Graph Component
You can display a graph of a sensor value(s) using this component. The states used for the graph are stored in memory at the time the sensor updates and will be lost when the device reboots.
Examples:
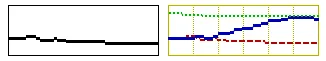
Graph component with options for grids, border and line-types.
graph: # Show bare-minimum auto-ranged graph - id: single_temperature_graph sensor: my_temperature duration: 1h width: 151 height: 51 # Show multi-trace graph - id: multi_temperature_graph duration: 1h x_grid: 10min y_grid: 1.0 # degC/div width: 151 height: 51 traces: - sensor: my_inside_temperature line_type: DASHED line_thickness: 2 color: my_red - sensor: my_outside_temperature line_type: SOLID continuous: true line_thickness: 3 color: my_blue - sensor: my_beer_temperature line_type: DOTTED line_thickness: 2 color: my_greenConfiguration variables
Section titled “Configuration variables”-
id (Required, ID): The ID with which you will be able to reference the graph later in your display code.
-
width (Required, int): The graph width in pixels
-
height (Required, int): The graph height in pixels
-
duration (Required, Time): The total graph history duration.
-
border (Optional, boolean): Specifies if a border will be drawn around the graph. Default is True.
-
x_grid (Optional): Specifies the time per division. If not specified, no vertical grid will be drawn.
-
y_grid (Optional, float): Specifies the number of units per division. If not specified, no horizontal grid will be drawn.
-
max_range (Optional): Specifies the maximum Y-axis range.
-
min_range (Optional): Specifies the minimum Y-axis range.
-
max_value (Optional): Specifies the maximum Y-axis value.
-
min_value (Optional): Specifies the minimum Y-axis value.
-
traces (Optional): Use this to specify more than a single trace.
-
legend (Optional): Configures a legend for the graph traces. See Legend Options.
Trace specific fields:
- sensor (Optional, ID): The sensor value to plot
- line_thickness (Optional): Defaults to 3
- line_type (Optional): Specifies the plot line-type. Can be one of the following:
SOLID,DOTTED,DASHED. Defaults toSOLID. - continuous (Optional): connects the individual points to make a continuous line. Defaults to
false. - color (Optional): Sets the color of the sensor trace.
Legend Options
Section titled “Legend Options”The legend displays trace names, current values, units, and line style samples. Only one legend per graph is supported.
- name_font (Required, Font): Font used for trace names.
- value_font (Optional, Font): Font used for current values. If not specified, values are not displayed.
- width (Optional, int): Legend width in pixels. If not specified, width is automatically calculated.
- height (Optional, int): Legend height in pixels. If not specified, height is automatically calculated.
- border (Optional, boolean): Draw a border around the legend. Defaults to
true. - show_lines (Optional, boolean): Display line style samples. Defaults to
true. - show_values (Optional): Position of current values. Can be
NONE,AUTO,BESIDE,BELOW. Defaults toAUTO. - show_units (Optional, boolean): Include units with values. Defaults to
true. - direction (Optional): Layout direction. Can be
AUTO,HORIZONTAL,VERTICAL. Defaults toAUTO.
Example with legend:
graph:  - id: temperature_graph_with_legend    duration: 1h    width: 151    height: 51    traces:      - sensor: indoor_temp        name: "Indoor"        line_type: SOLID        color: my_red      - sensor: outdoor_temp        name: "Outdoor"        line_type: DASHED        color: my_blue    legend:        name_font: legend_font        value_font: value_font        show_values: BELOW        border: true        show_lines: true        show_units: true
font:  - file: "arial.ttf"    id: legend_font    size: 10  - file: "arial.ttf"    id: value_font    size: 8
And then later in code:
display:  - platform: ...    # ...    pages:      - id: page1        lambda: |-          // Draw the graph at position [x=10,y=20]          it.graph(10, 20, id(single_temperature_graph));      - id: page2        lambda: |-          // Draw the graph at position [x=10,y=20]          it.graph(10, 20, id(multi_temperature_graph), my_yellow);      - id: page3        lambda: |-          // Draw graph and legend          it.graph(10, 20, id(temperature_graph_with_legend));          it.legend(170, 20, id(temperature_graph_with_legend), my_yellow);
color:  - id: my_red    red: 100%    green: 0%    blue: 0%  - id: my_green    red: 0%    green: 100%    blue: 0%  - id: my_blue    red: 0%    green: 0%    blue: 100%  - id: my_yellow    red: 100%    green: 100%    blue: 0%
NOTE
Here are some things to note:
- Setting
y_gridwill expand any specified range to the nearest multiple of grid spacings. - Axis labels are currently not possible without manually placing them.
- The grid and border color is set with
it.graph(), while the traces are defined separately. - Legends are drawn separately using
it.legend()and can be positioned independently of the graph. - Legend dimensions are automatically calculated if not specified, based on font sizes and trace count.